電磁波解析(分散性)金、銀、銅の反射シミュレーション
Abstract
電磁波解析ソフトKeyFDTDを使用して金、銀、銅平滑面の垂直入射に対する可視~近赤外光の反射スペクトルを導出した。金、銀、銅は可視光帯付近にプラズマ周波数を持ち、プラズマ周波数付近の物性値をDrudeとLorentz分散モデルの組み合わせで近似できる。金、銅をDrude-Lorentz-Loretnzモデル、銀をDrude-Lorentzモデルで物性値を近似し、FDTD法により反射スペクトルを導出、複素屈折率の測定値から算出した反射スペクトルと比較した。いずれの金属もシミュレーションと測定値から求めた反射率が全体的によく一致し、解析に用いた分散パラメータと、KeyFDTDの多極分散性物質に対する解析の2つの妥当性を確認できた。
The reflection spectra of visible to near-infrared light for perpendicular incidence of gold, silver and copper smooth surfaces were derived. Gold, silver, and copper have plasma frequencies near the visible light band, and the physical properties near the plasma frequencies can be approximated by a combination of Drude and Lorentz dispersion models. The reflection spectra were derived by FDTD method and compared with those calculated from the measured complex refractive index. The simulated and measured reflectance of both metals agreed well overall, confirming the validity of the dispersion parameters used in the analysis and the analysis of KeyFDTD for multipolar dispersible materials.
1. 解析概要
金属は低い周波数の電磁波をほぼ100%反射する。しかし、物質固有のプラズマ周波数を超える電磁波は透過・吸収する。プラズマ周波数前後の金や銀の物性値はDrudeやLorentz分散モデルで近似できる。本レポートでは金、銀、銅の物性値を分散モデルで近似し、各金属平滑面への垂直入射および反射をFDTD法でシミュレートした。
2. 解析条件
Fig.1にシミュレーションモデルを示す。
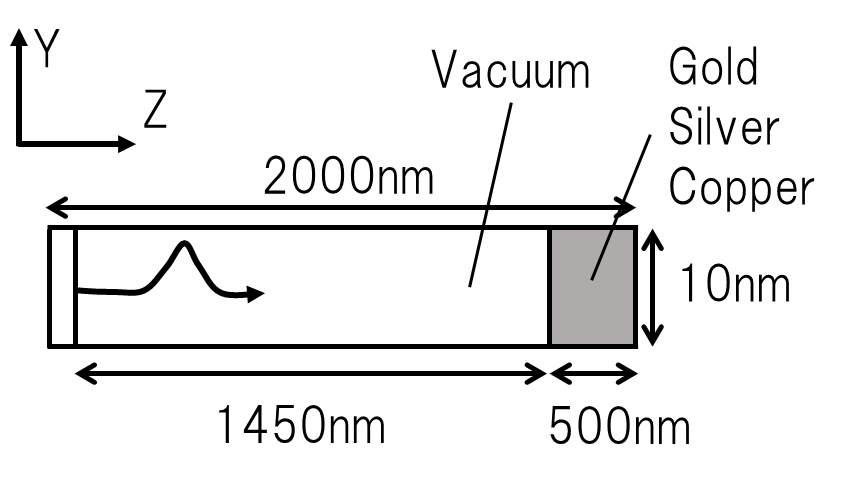
Fig.1 Simulation model
金と銅の複素誘電率はDrude-Lorentz-Lorentzモデル(eq.1)、銀はDrude-Lorentzモデル(eq.2)で近似した。 ωは入射光の角周波数である。金、銀、銅の式中の各係数をTable1.に示す。
![\[\varepsilon_r(\omega) = \varepsilon_\infty + \frac{\omega^2_{p1}}{\omega(j\nu_c-\omega)}+\Delta\varepsilon_2 \frac{\omega^2_{p2}} {\omega^2_{p2}+j\omega\delta_{p2}-\omega^2}+\Delta\varepsilon_3 \frac{\omega^2_{p3}} {\omega^2_{p3}+j\omega\delta_{p3}-\omega^2} \cdots(eq.1)\]](https://www.kagiken.co.jp/wp-content/ql-cache/quicklatex.com-3b3139902026b942e713ce99dedfc982_l3.svg "Rendered by QuickLaTeX.com")
![\[\varepsilon_r(\omega) = \varepsilon_\infty + \frac{\omega^2_{p1}}{\omega(j\nu_c-\omega)}+\Delta\varepsilon_2 \frac{\omega^2_{p2}} {\omega^2_{p2}+j\omega\delta_{p2}-\omega^2} \cdots(eq.2)\]](https://www.kagiken.co.jp/wp-content/ql-cache/quicklatex.com-52e8f5ee6904bd6e2a2e2888791712bf_l3.svg "Rendered by QuickLaTeX.com")
| Parameter | Gold | Silver | Copper |
|---|---|---|---|
 |  |  | |
 [rad/sec] [rad/sec] |  |  |  |
 [rad/sec] [rad/sec] |  |  |  |
 [rad/sec] [rad/sec] |  |  | |
 [rad/sec] [rad/sec] |  |  |  |
 | |  | |
 |  |  | |
 [rad/sec] [rad/sec] |  |  |  |
 [rad/sec] [rad/sec] |  |  |
Table.2の解析条件で、電磁波解析ソフトKeyFDTDTRを用いて各金属の反射スペクトルを導出した。反射スペクトルは、ガウシアンパルスの入射波形と反射波形のフーリエ変換後のエネルギー比から計算した。
| Incident pulse | ![Gaussian\ pulse: \tau_0 = 2\times10^{-15}[sec]](https://www.kagiken.co.jp/wp-content/ql-cache/quicklatex.com-0fe7acc19386ef6d004f9214c415014f_l3.svg "Rendered by QuickLaTeX.com") |
|---|---|
| Boundary condition |  |
| Computational domain | ![10\times10\times2000[nm]](https://www.kagiken.co.jp/wp-content/ql-cache/quicklatex.com-6896fcfe9ba30d255c3811ae959b89f5_l3.svg "Rendered by QuickLaTeX.com") |
| Mesh size | ![2.5[nm]=\lambda/160\sim480](https://www.kagiken.co.jp/wp-content/ql-cache/quicklatex.com-9714fe0f30e6d4a54f32227f839a77c1_l3.svg "Rendered by QuickLaTeX.com") |
| Timestep | ![4.18\times10^{-18}[sec]](https://www.kagiken.co.jp/wp-content/ql-cache/quicklatex.com-815c421163e4944bcf02fbb1ce865266_l3.svg "Rendered by QuickLaTeX.com") |
3. 解析結果
金、銀、銅の反射スペクトルをFig2、3、4に示す。実線がシミュレーション、点線が測定した複素屈折率から光学理論式で求めた反射率である。銀はシミュレーションと測定値から求めた反射率が全体的によく一致した。金と銅は一部の波長域で数%の違いがあるものの全体的には概ね一致する結果が得られた。
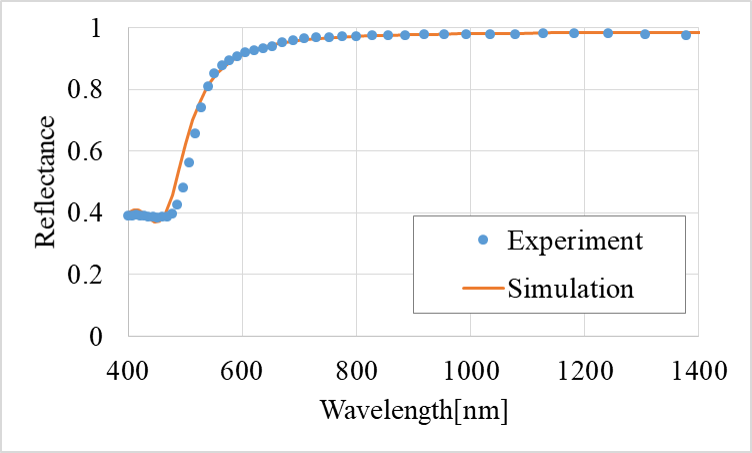 Fig.2 Reflectance spectra of gold
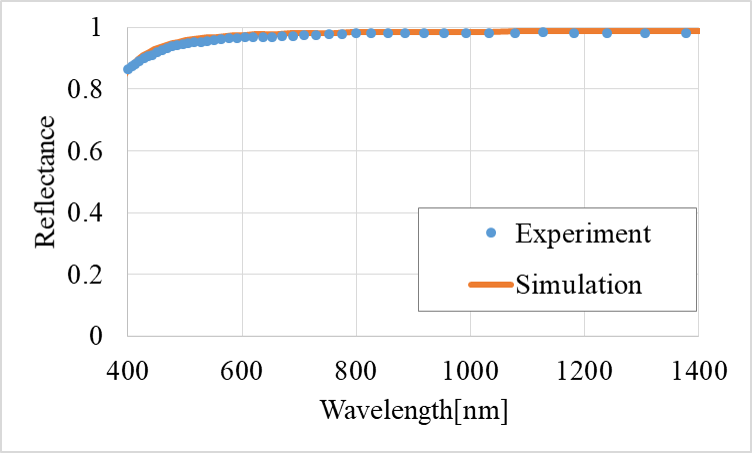 Fig.3 Reflectance spectra of silver
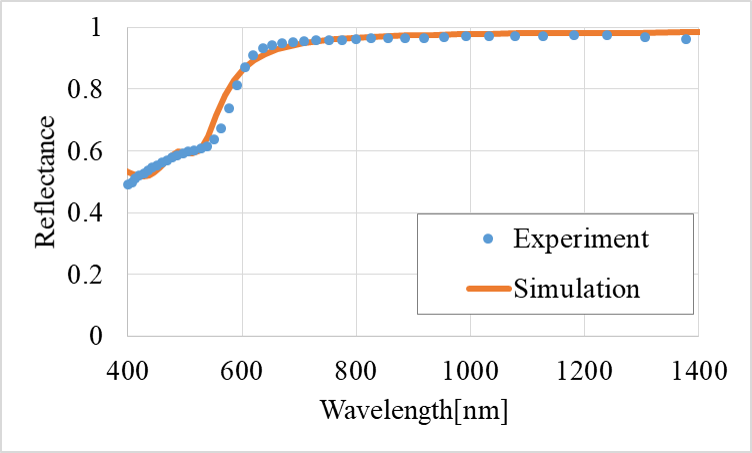 Fig.4 Reflectance spectra of copper
4. まとめ
電磁波解析ソフトKeyFDTDを用いて金、銀、銅の可視光~近赤外の反射スペクトルを導出した。これにより今回解析に用いた分散パラメータと、KeyFDTDの多極分散性物質に対する解析の2つの妥当性を確認できた。
お問い合わせ・資料ダウンロード・入門動画視聴のお申し込みはこちら
お問合せフォームを開く